This self-paced course will help you prepare for the Azure Developer certification exam AZ-204: Developing Solutions for Microsoft Azure.
VILT & Self-Paced

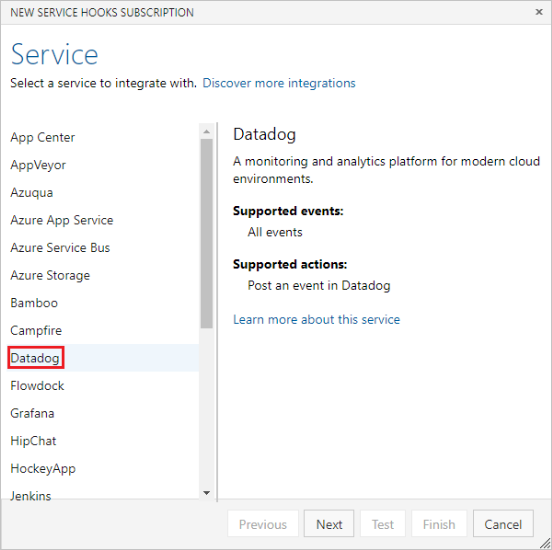
Datadog is the essential monitoring platform for cloud infrastructure, applications, and logs.

They bring together data from servers, containers, databases, and third-party services to make your stack entirely observable.
By adding this extension, we’ll be able to utilize any monitors in Datadog to stop problematic deployments in their tracks by adding Datadog Monitors as gates in your Azure Pipelines.
https://marketplace.visualstudio.com/items?itemName=Datadog.datadog-monitors
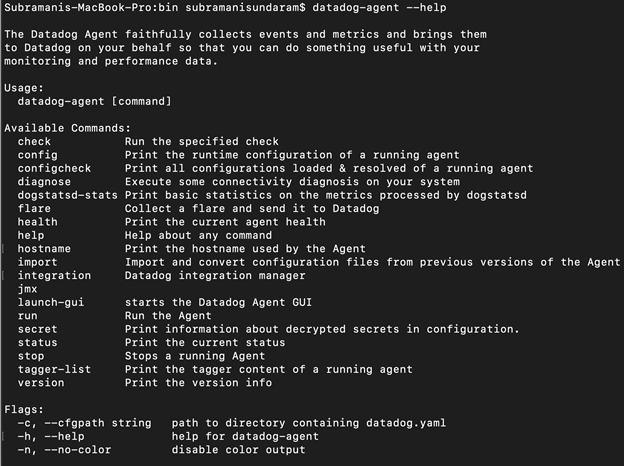
How to install and work on Datadog agent :
2. Then we need to install the agent on our local machine whether we are using Windows or Mac or Linux.
3. Download the agent and then run the script given below :
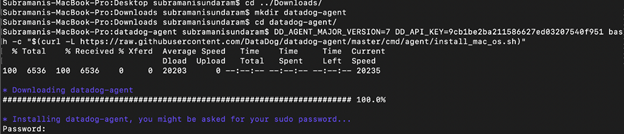
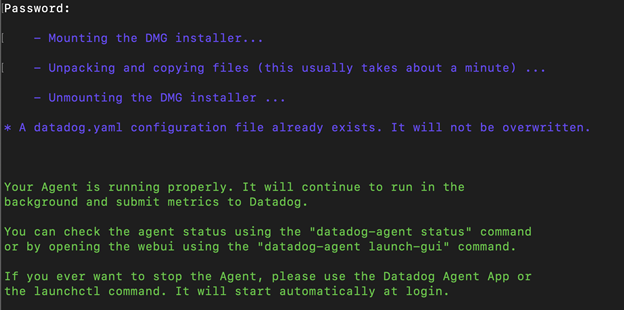
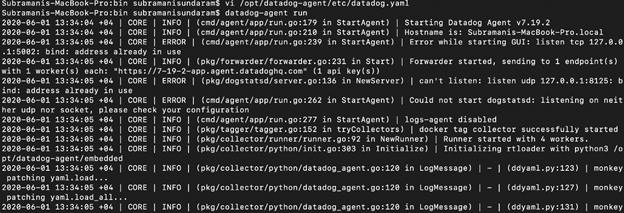
4. Then we need to start the Datadog agent by running the command and then we can see the agent is running and then we can start configuring the Integrations.
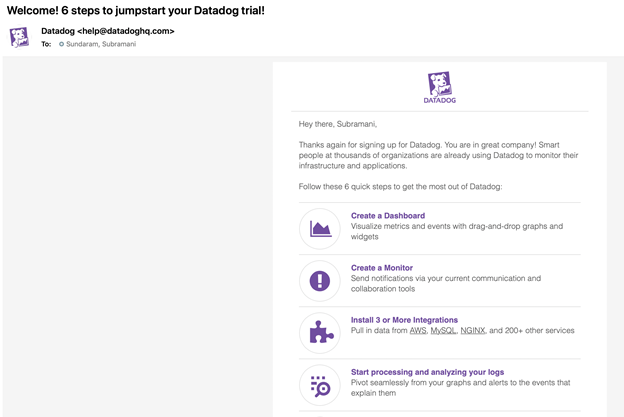
5. Then login to this site (https://app.datadoghq.com/) with the username and password that we will receive over the email.
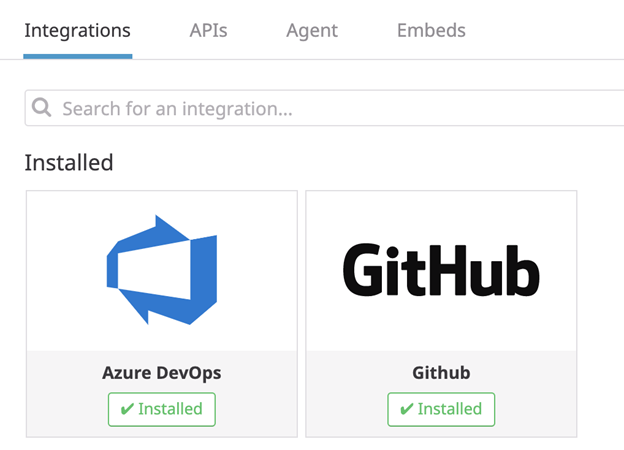
6. Click on the Integrations section and choose which one we wanted to get integrated with. In my case, I chose GitHub and Azure DevOps.
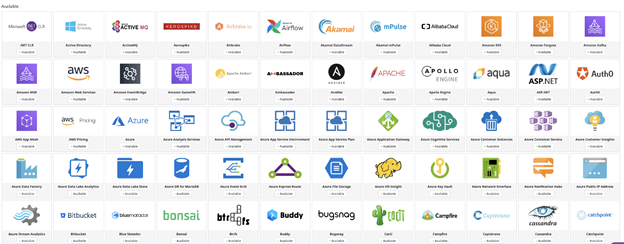
There are more than 100+ options available for Azure, AWS, Docker, Ansible, etc. We can choose which one we want and based on that we need to do our configurations.
7. After choosing the GITHUB , we need to click on the configuration tab and see what is the configuration that we need to do on the GITHUB side .
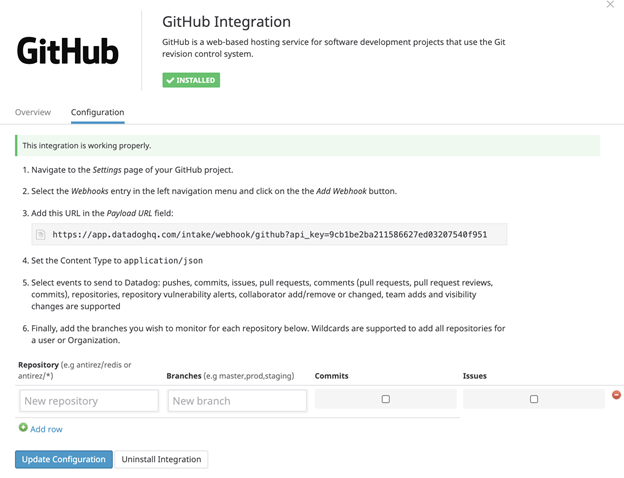
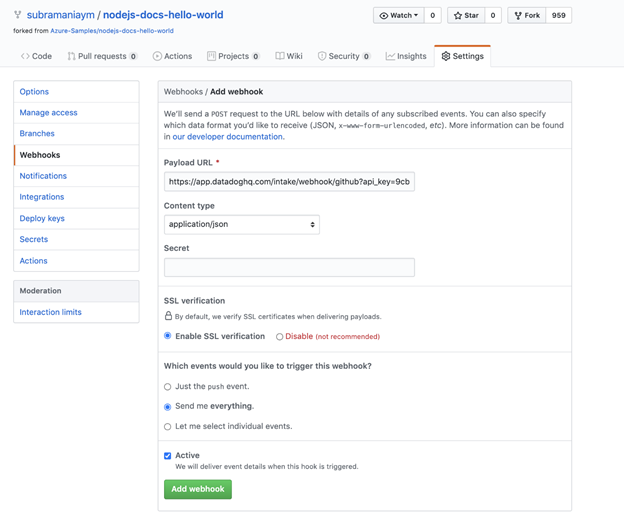
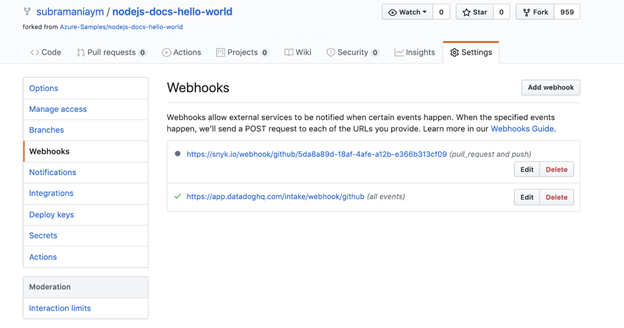
After copying this Webhook from here, I need to go to Github and go to settings and then paste it there so that I can get all the changes done on the GITHUB to the Datadog and I can monitor it as events across.
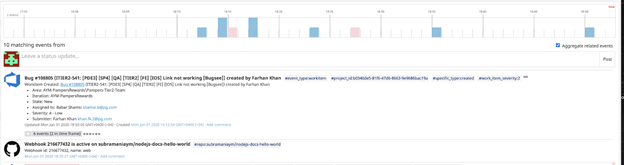
8. Now after the above setup , we need to go to the below events and check the items that we are doing on GitHub will be reflected here.
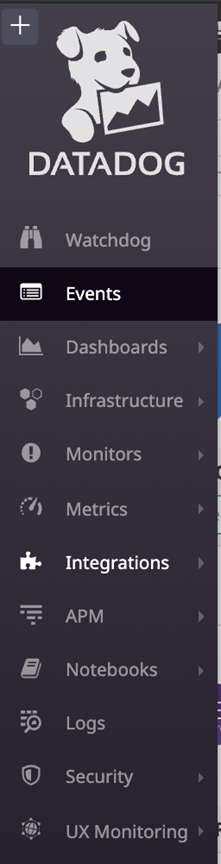
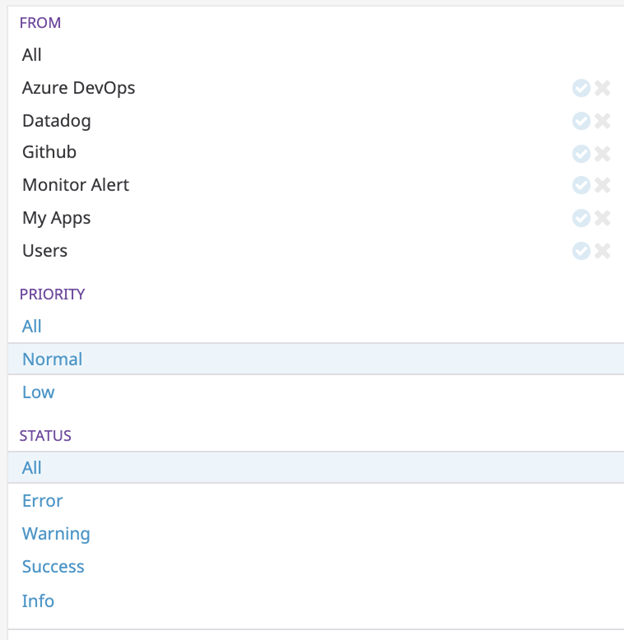
We can choose the Azure Devops and GitHub events from the above checkbox and then we can start seeing the events on what ever is happening on both the tools.
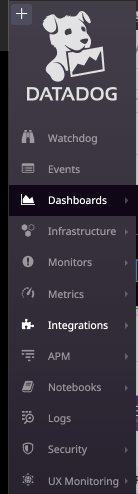
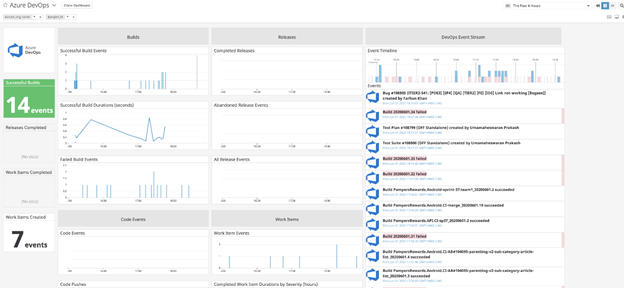
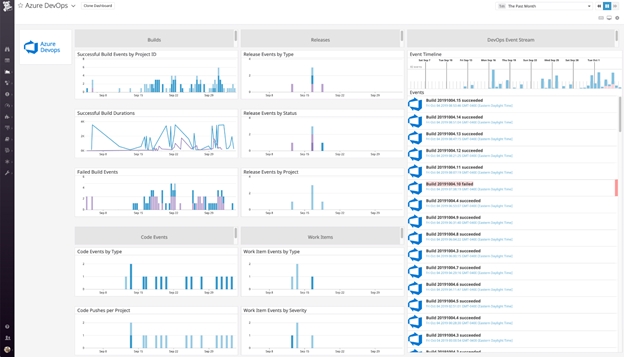
Then we need to go to the Menu and Dashboards and then choose the Azure DevOps Dashboard accordingly.
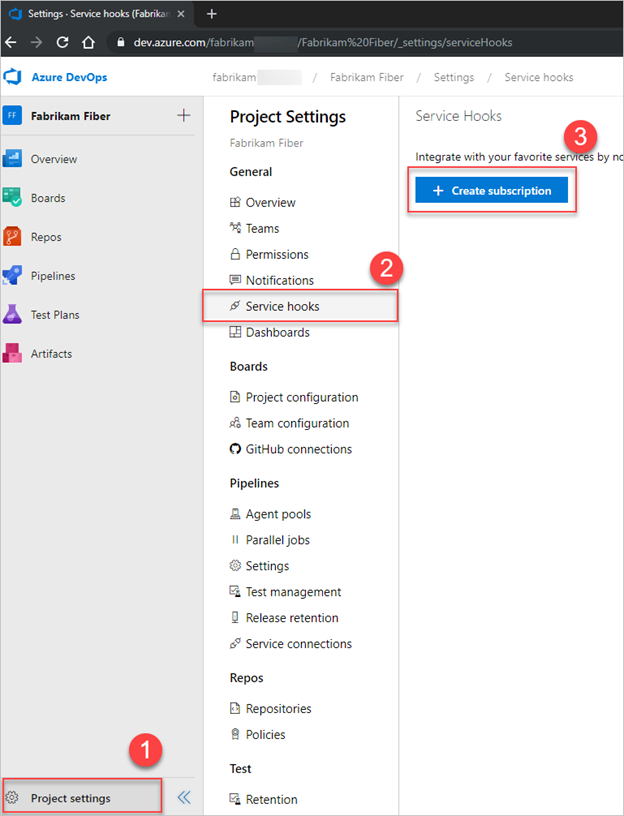
4. Test the service hook subscription and finish the wizard.
5. Repeat steps 2–5 for each event type you want to send to Datadog. Datadog accepts and encourages users to send all event types.
6. Now that the service hooks are configured, go to Datadog to see events and metrics start to flow into your environment.
Consider a canary deployment that updates an e-commerce website in stages across different regions. To ensure the update was successful before rolling it out to the next region, you might want to check the status of various health indicators in the recently updated region, such as:
In Datadog, we can create individual monitors for everything you want to know about, and then combine them using a composite monitor, using simple logic statements to specify the desired combination of monitor conditions.
Then, we can set that composite monitor as a gate between the two stages of a pipeline to automatically stop a deployment if an unhealthy state is detected in Datadog.
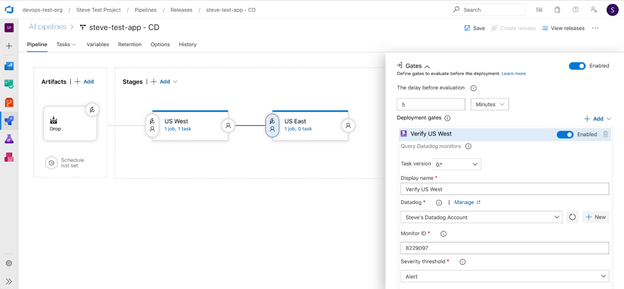
We can define the health of our service, using Datadog monitors as gates in Azure DevOps can help you ensure that your deployments go off without a hitch.
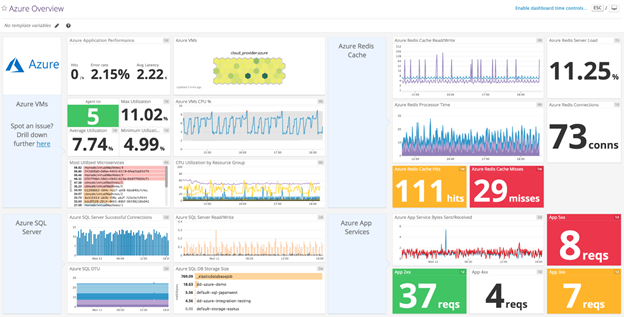
Once after all the steps are completed , we will be seeing the below Dashboard which is our real time monitoring.
This self-paced course will help you prepare for the Azure Developer certification exam AZ-204: Developing Solutions for Microsoft Azure.
AZ-900: Microsoft Azure Fundamentals Tutorial provides foundational level knowledge on cloud concepts; core Azure services; security, privacy, compliance, and trust; and Azure pricing and support.
This self-paced course will help you prepare for the Azure DevOps certification exam AZ-400: Designing and Implementing Microsoft DevOps Solutions.
a canary deployment that updates an e-commerce website in stages across different regions. To ensure the update was successful before rolling it out to the next region, you might want to check the status of various health indicators in the recently updated region.