Creating Power BI Report in SharePoint Online
In this blog, you will learn how to create & embed a Power BI report in SharePoint Online using SharePoint List as a data source.
Scenario:
We are going to create a Power BI report that will show
- A pie chart showing sales distribution by countries
- Bar charts showing Sales based on countries, months product sales for different countries

We will use 4 different lists to store product sales information.
SharePoint Lists:
- Product: This list stores metadata ProductKey(number) & ProductName(Text)

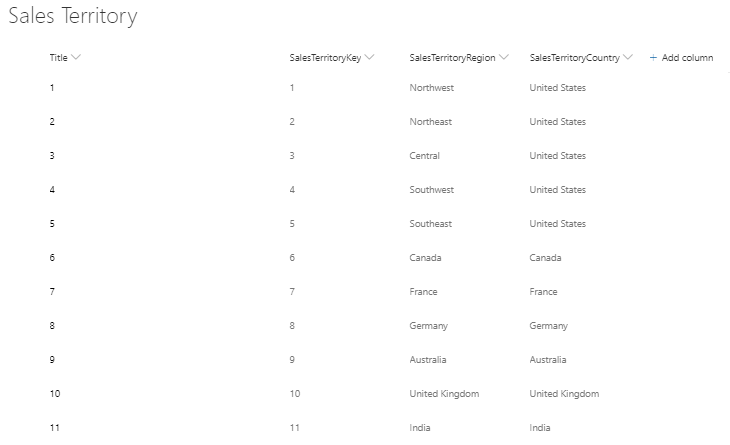
- Sales Territory: This list stores SalesTerritoryKey(Number), SalesTerritoryRegion(Choice), SalesTerritoryCountry(Choice)
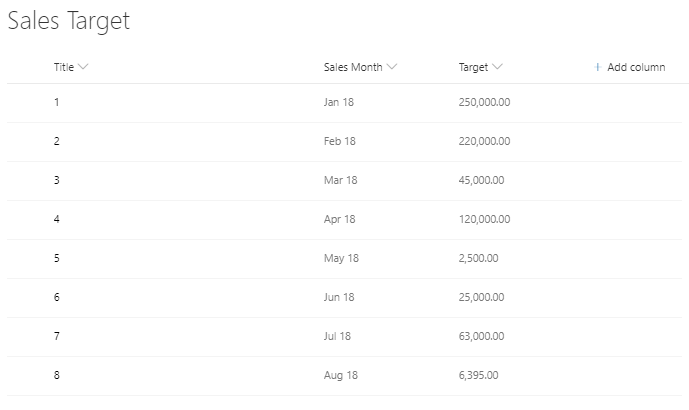
- Sales Target: This list stores Sales Month(Text) & Target(Number)
- Product Sales: This list stores product sales information
ProductKey(LookUp) – look up to Product List ProductKey
SalesOrderNumber(Text)
UnitPrice(Number)
ExtendedAmount(Number)
SalesTerritoryKey(LookUp) – look up to Sales Territory list SalesTerritoryKey
SalesMonth(Choice)

Once data is properly populated, we can go ahead and start designing our report. you should have proper license assigned to your account before you can design, publish & share a Power BI report. you can find licensing details here.
Download Power BI Desktop here.
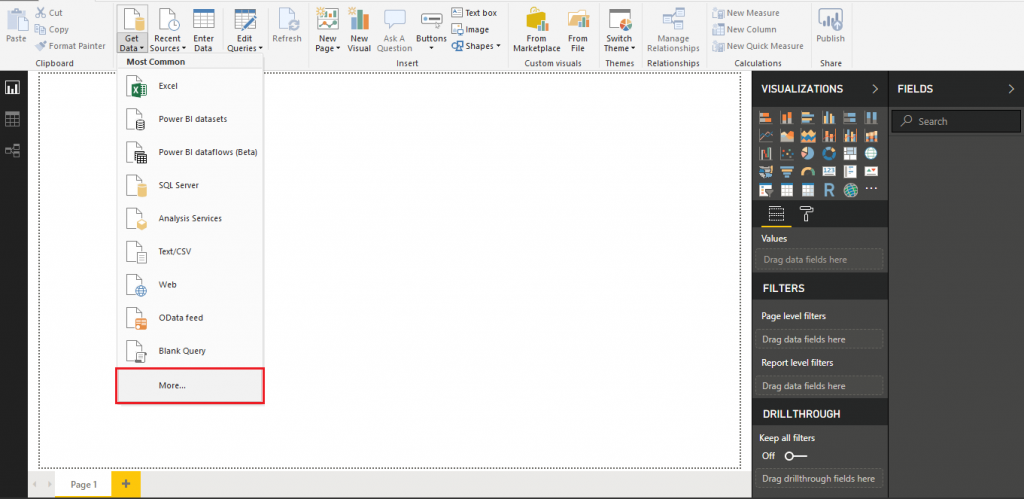
- Launch Power BI Desktop –> Get Data –> More
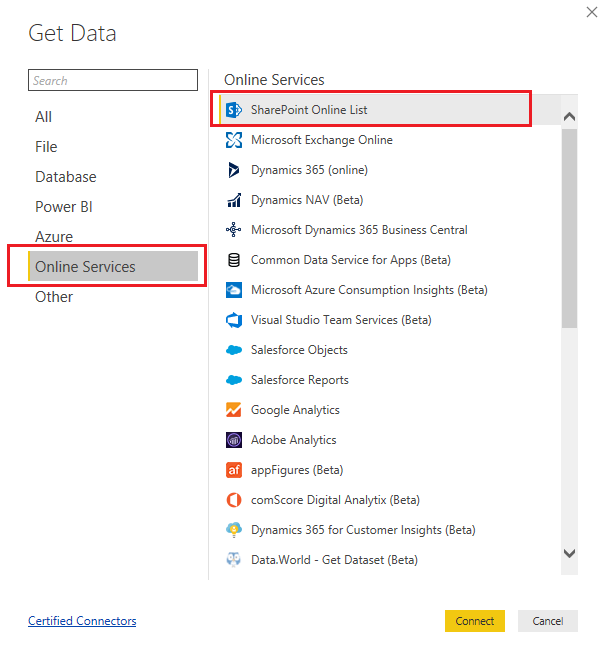
- Click Online Services -> SharePoint Online List –> Connect
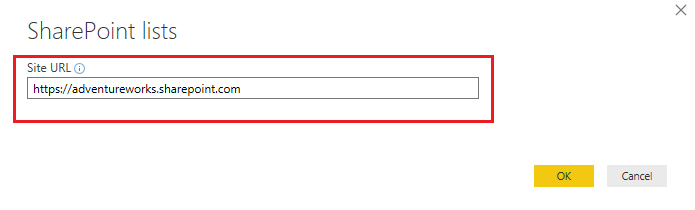
- Provide SharePoint Online Site URL where you have created Lists.
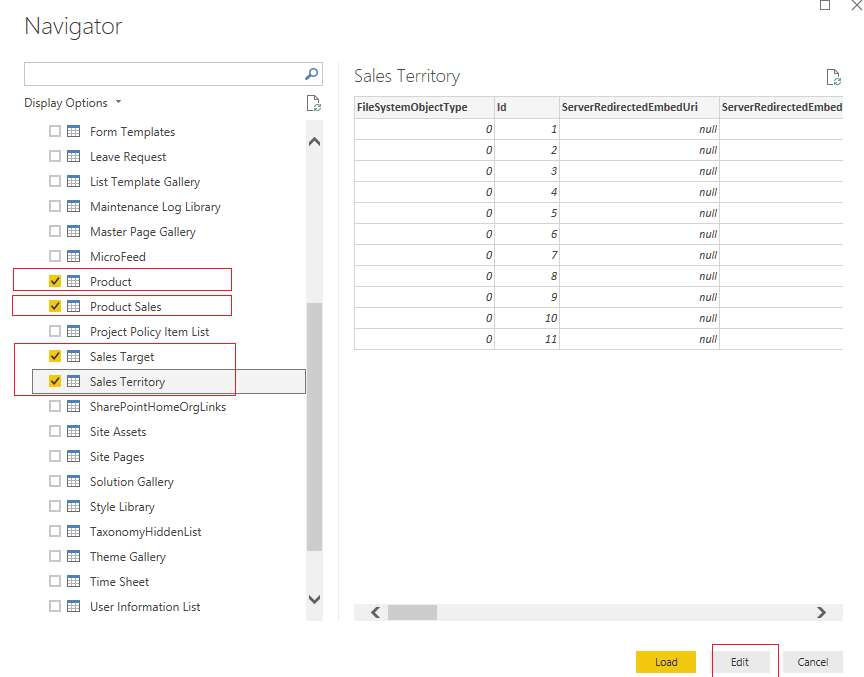
- Select the lists that we created previously and click on Edit
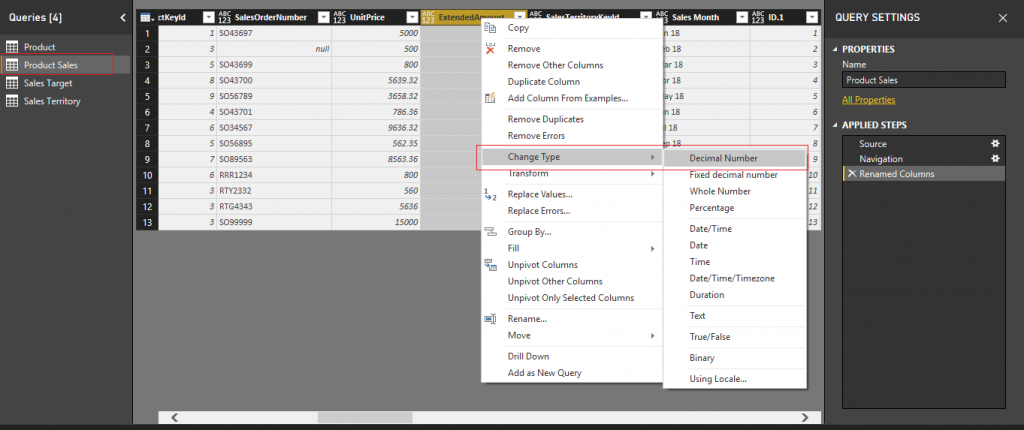
- Select Product Sales table from left navigation, change type of column ExtendedAmount & UnitPrice to Decimal Number & select apply.
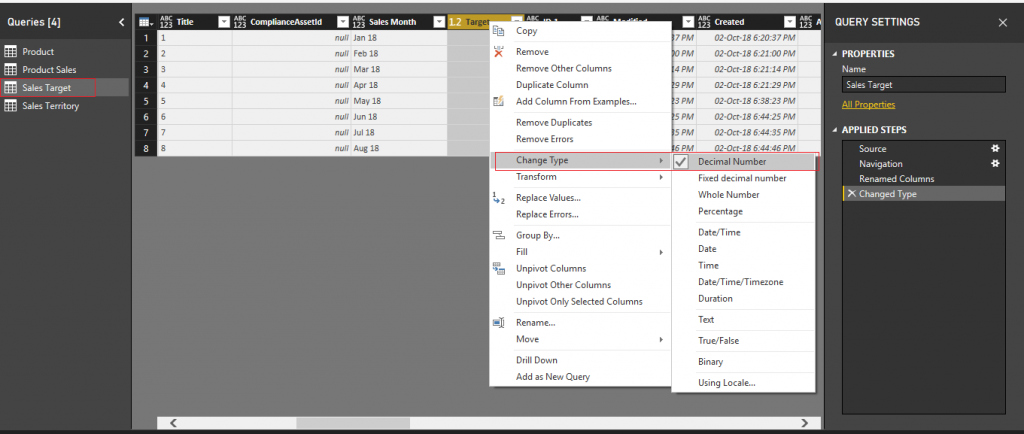
- Select Sales Target table from left navigation, change type of column Target to Decimal Number. Select Close & Apply.
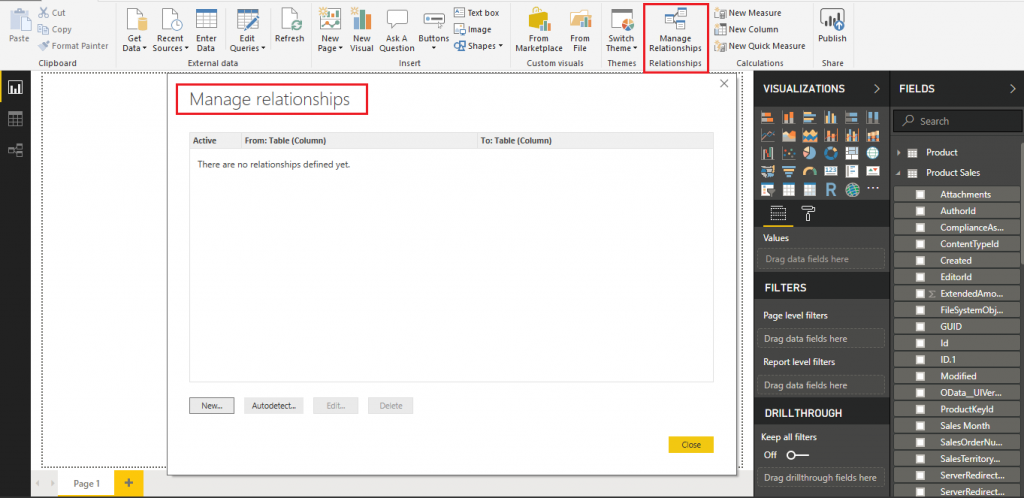
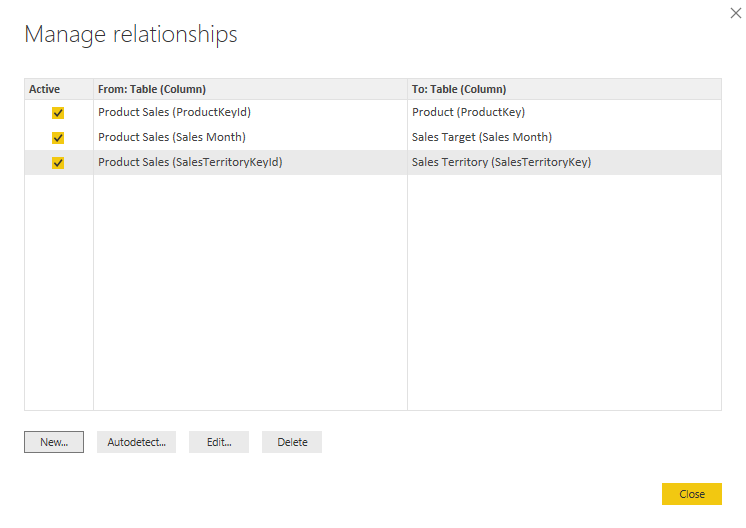
- Click on Manage Relationships from top navigation. we will delete existing relationships that Power BI has detected based on columns identical name and define our own relationship.
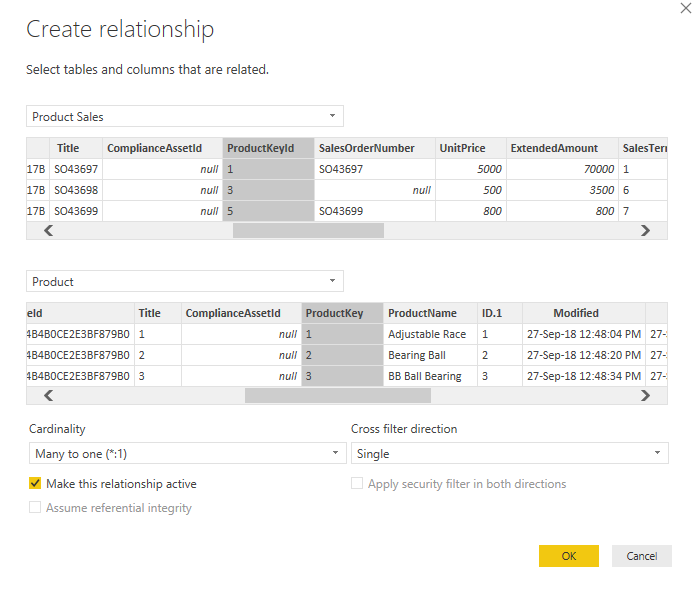
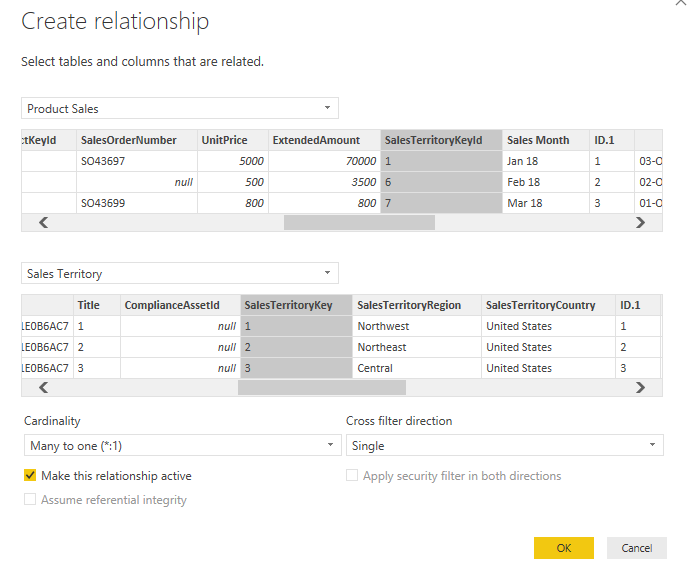
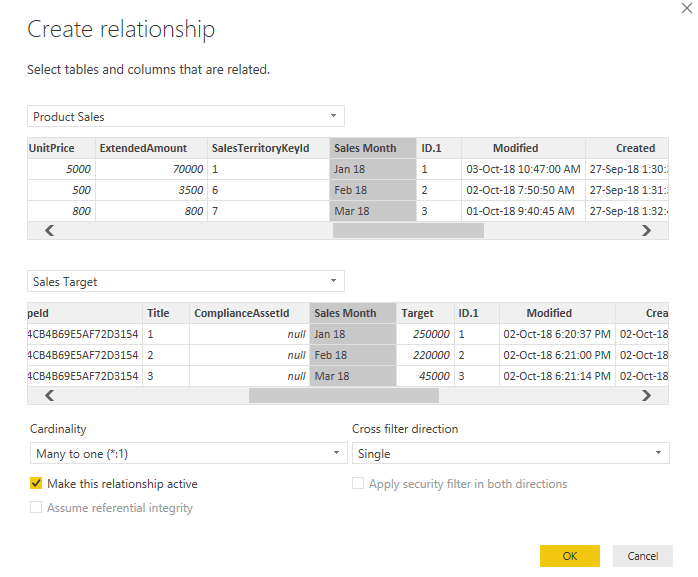
- Click New –> select relationship for 3 columns productkey, salesterritorykey & sales month as show here in the screenshot.
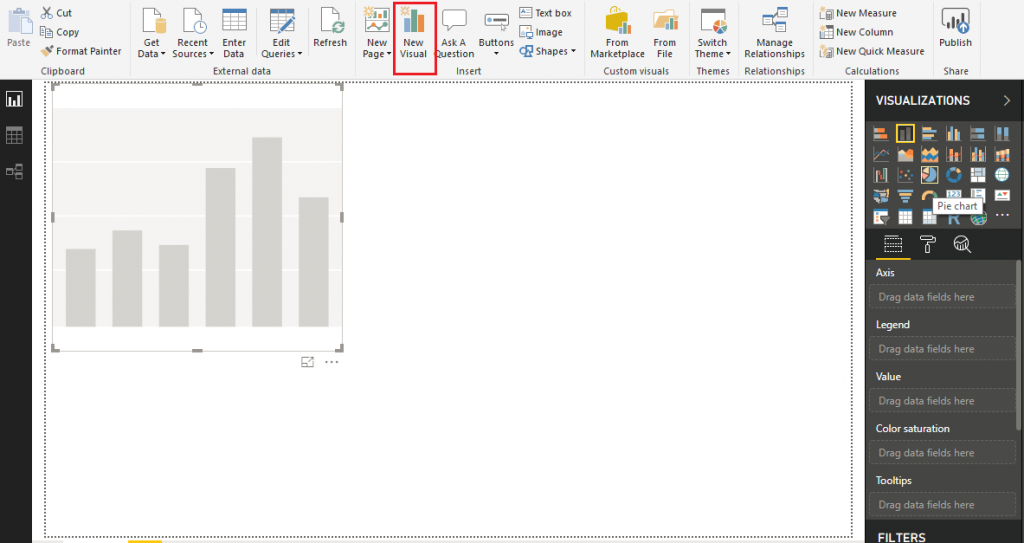
- Select New Visual from top ribbon menu –> select this newly added visual on the screen and change it to pie-chart from right menu under Visualizations.
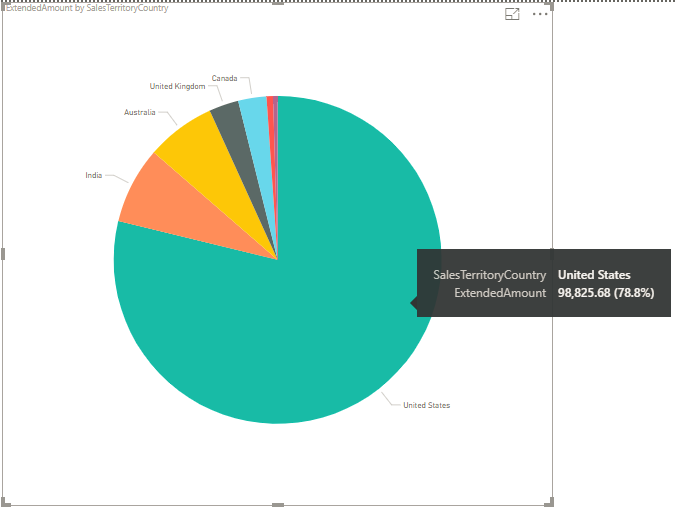
- Expand Product Sales table from right navigation, drag and drop ExtendedAmount field to Values. Expand Sales Territory table, drag & drop SalesTerritoryCountry field to Details.
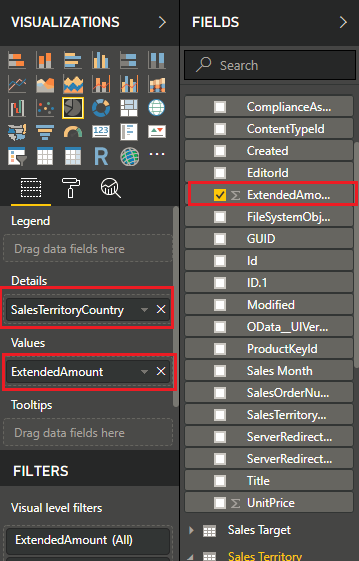
- Now you should be able to see a pie-chart which shows sales distribution based on countries.
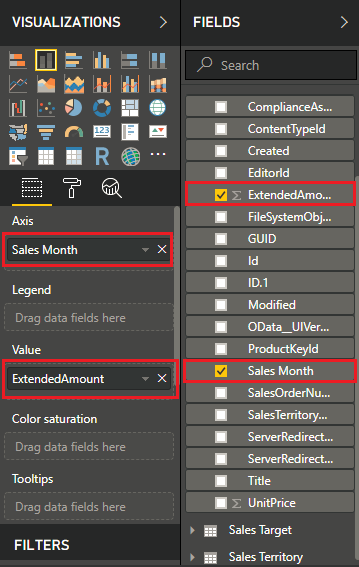
- Add new visual to include a bar-chart. Expand Product Sales table, drag & drop Extended Amount under Value & Sales Month under Axis as show here:
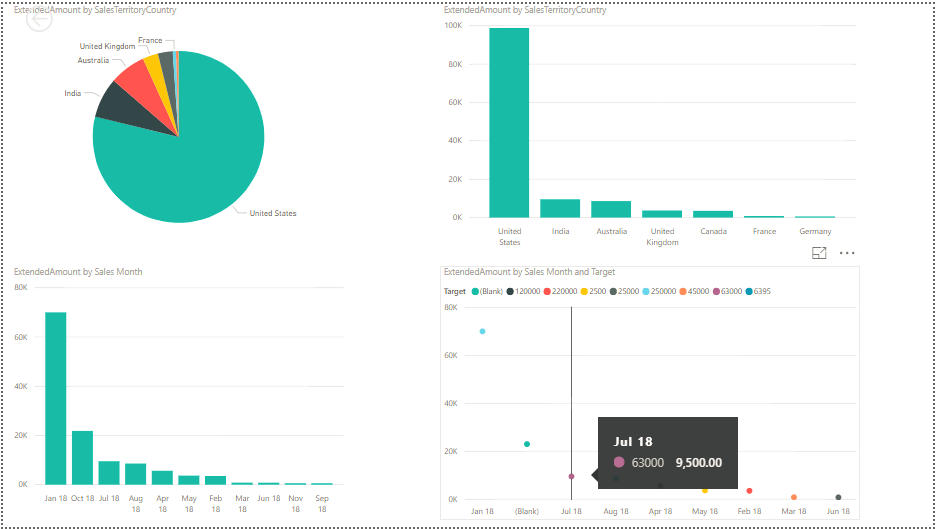
- Similarly, you can add other visuals on the same page, drag & drop appropriate fields. In my case, my final report looks like this:
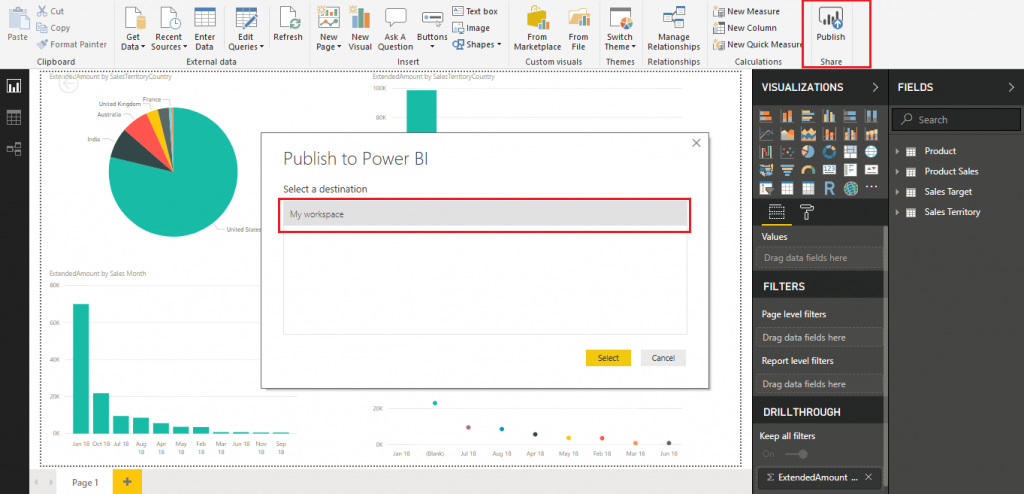
- Once report is ready, you can publish it to your Office 365 Power BI workspace from Power BI desktop.
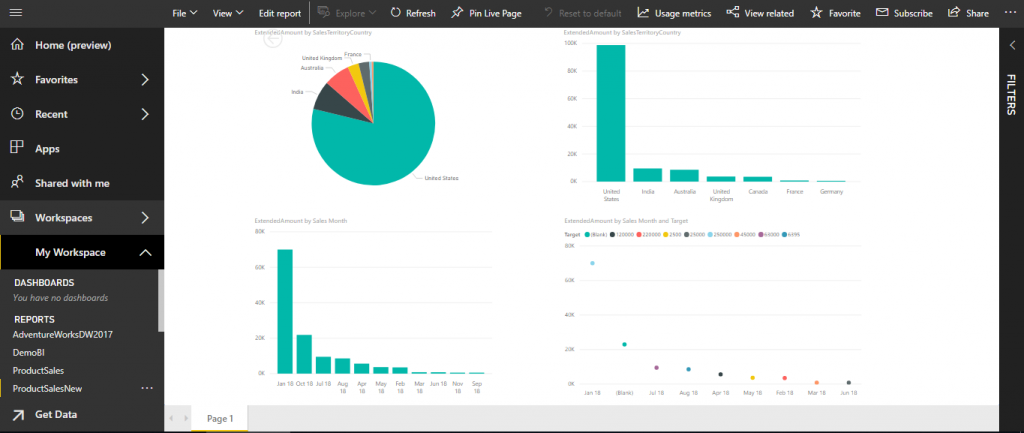
- Once published, you can open this report on web browser by navigating to My Workspace in Power BI.
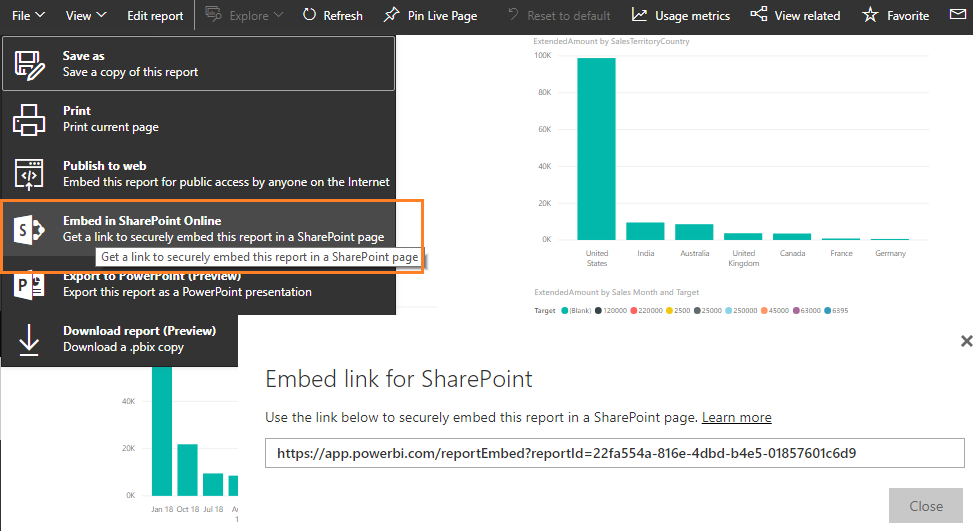
- To embed this Power BI report in a SharePoint Online Page, Click on File –> Embed in SharePoint Online. Copy the web link.
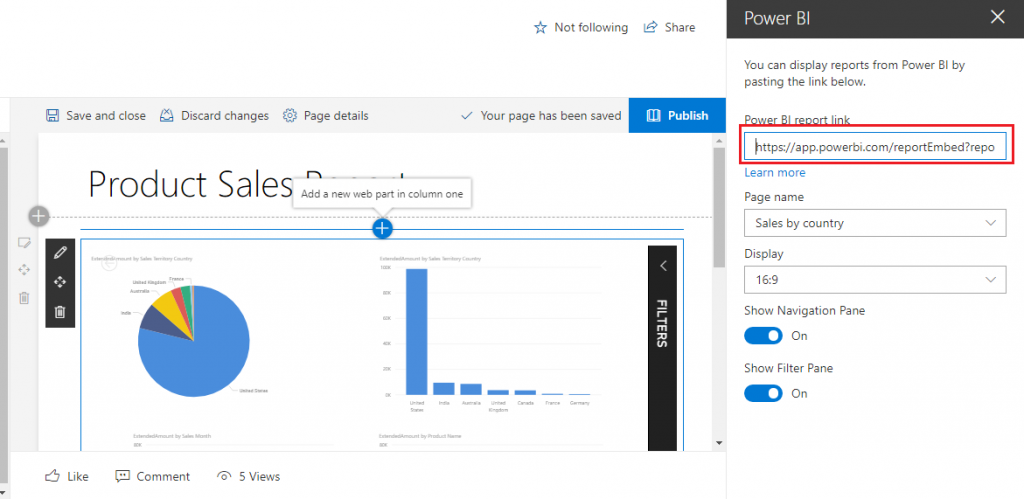
- Navigate to a Modern SharePoint Online Page, insert Power BI webpart & paste the embed link in Power BI report link as shown here:
Congratulations! You have successfully created Power BI report & added it to SharePoint Online. Subscribe to our social channel to stay informed about upcoming blogs!

Thanks for the info. It’s hard to come by well-informed people on this particular topic. The context has been explained very clearly & it’s really helpful to me since I’m planning to build a career in Power BI.